Diagnose slow requests more easily with improved request logging in Open Liberty 19.0.0.11

Open Liberty 19.0.0.11 provides a useful option to automatically detect slow requests and logs the information when the request is complete through the Request Timing 1.0 feature. Additionally, Java SE 13 release from AdoptOpenJDK, OpenJDK, or Oracle works with Open Liberty.
Give it a try in Open Liberty 19.0.0.11.
If you’re interested in what’s coming soon in Open Liberty, take a look at our current development builds. In particular, get an early insight into Jaeger support for MicroProfile OpenTracing, performance improvements through annotation caching, and GraphQL support.
In Open Liberty 19.0.0.11:
View the list of fixed bugs from 19.0.0.11
Run your apps using 19.0.0.11
If you’re using Maven, here are the coordinates:
<dependency>
    <groupId>io.openliberty</groupId>
    <artifactId>openliberty-runtime</artifactId>
    <version>19.0.0.11</version>
    <type>zip</type>
</dependency>
Or for Gradle:
dependencies {
    libertyRuntime group: 'io.openliberty', name: 'openliberty-runtime', version: '[19.0.0.11,)'
}
Or if you’re using Docker:
docker pull open-libertyOr take a look at our Downloads page.

Diagnose slow requests more easily with improved request logging (Request Timing 1.0)
The feature provides a way of monitoring requests with respect to time. In particular, the feature will automatically detect slow and hung requests all while routing the information back to users to assist with diagnosing the cause of the slow or hung requests.
Previously, the feature would only log that a slow request was detected and never log when the slow request completed. Now users will be able to view information about a slow request that completed with the request id and the amount of time it took for the request to complete.
This upgrade to the Request Timing feature, although simple, will be extremly helpful when it comes to diagnosing requests that are detected to be slow. Users will now have a simple way of verifying that a slow request actually completed and also how long it took for the slow request to complete. This additional information will make the monitoring of slow requests more efficient and enable users to determine if a slow request completed or not.
To enable the feature add it to the server.xml
The detection of slow or hung requests is done automatically. The logging of information when a slow request completes is also done automatically. To enable the feature simple include requestTiming-1.0 in the server.xml. You may also alter default parameters associated with the feature as descibed here https://developer.ibm.com/wasdev/docs/request-timing-diagnosing-slow-requests-liberty/ in the Configuring slow and hung request detection section.
<featureManager>
      ...
      <feature>requestTiming-1.0</feature>
      ...
</featureManager>
Support for Java SE 13
Any official Java SE 13 release from AdoptOpenJDK, OpenJDK, or Oracle works with OpenLiberty. Java SE 13 is not a long-term supported release, with standard support scheduled to end in March 2020.
We recommend choosing Eclipse OpenJ9 over Hotspot. This is due to a bug in HotSpot.
The primary features added in this release include:
For more details, check the Java 13 project page.
Previews of early implementations available in development builds
You can now also try out early implementations of some new capabilities in the latest Open Liberty development builds:
These early implementations are not available in 19.0.0.11 but you can try them out in our daily Docker image by running docker pull openliberty/daily. Let us know what you think!
Provide your own health check procedures (MicroProfile Health Check 2.1)
MicroProfile Health Check 2.1 enables you to provide your own health check procedures to be invoked by Liberty, to verify the health of your microservice.
HealthCheckResponse.up("myCheck");In previous versions, to define a simple successful/failed named health check response, the application level code is always expected to use several static methods together from the HealthCheckResponse API, to retrieve a HealthCheckResponseBuilder used to construct a HealthCheck response.
In mpHealth-2.1 feature for Open Liberty, you can now use convenient and simpler methods from standard Java APIs, to construct UP/DOWN named health check responses, in your applications, such as;
HealthCheckResponse.named(“myCheck”).up().build();
To make it work include the following in the server.xml file:
<feature>mpHealth-2.1</feature>Applications are expected to provide health check procedures, by implementing the HealthCheck interface with the @Liveness or @Readiness annotations, which will be used by Liberty to verify the Liveness or Readiness of the application, respectively. Add the logic of your health check in the call() method, and return the HealthCheckResponse object, by constructing using the simple up()/down() methods from the API. To view the status of each health check, access the either the http://<hostname>:<port>/health/live or http://<hostname>:<port>/health/ready endpoints.
**Liveness Check**
@Liveness
@ApplicationScoped
public class AppLiveCheck implements HealthCheck {
...
    @Override
     public HealthCheckResponse call() {
       ...
       HealthCheckResponse.up("myCheck");
       ...
     }
}
For more information:
Jaeger support added for tracing (MicroProfile OpenTracing 1.3)
Open Liberty has added support for Jaeger in MicroProfile OpenTracing. A sample tracer is available here for using Zipkin as a tracing backend. With the addition of Jaeger support, developers can also use Jaeger as a tracing backend.
You can download the Jaeger client version 0.34.0 library and its dependencies from Maven repository.
In the server.xml:
Add <feature>mpOpenTracing-1.3</feature> under <featureManager> section.
    <library id="jaegerLib" apiTypeVisibility="+third-party" >
        <file name="<path>/jaegerLib_0.34/gson-2.8.2.jar" />
        <file name="<path>/jaegerLib_0.34/jaeger-client-0.34.0.jar" />
        <file name="<path>/jaegerLib_0.34/jaeger-core-0.34.0.jar" />
        <file name="<path>/jaegerLib_0.34/jaeger-thrift-0.34.0.jar" />
        <file name="<path>/jaegerLib_0.34/jaeger-tracerresolver-0.34.0.jar" />
        <file name="<path>/jaegerLib_0.34/libthrift-0.12.0.jar" />
        <file name="<path>/jaegerLib_0.34/slf4j-api-1.7.25.jar" />
        <file name="<path>/jaegerLib_0.34/slf4j-jdk14-1.7.25.jar" />
        <file name="<path>/jaegerLib_0.34/opentracing-util-0.31.0.jar" />
        <file name="<path>/jaegerLib_0.34/opentracing-noop-0.31.0.jar" />
    </library>
Define your appplication:
  <webApplication location="yourapp.war" contextRoot="/yourapp">
        <!-- enable visibility to third party apis -->
        <classloader commonLibraryRef="jaegerLib"
            apiTypeVisibility="+third-party" />
  </webApplication>
You can find out more about about Jaeger settings set up using environment variables by looking at jaeger-client-java readme.
-
For the
JAEGER_PASSWORDenvironment variable, the password can be encoded using thesecurityUtility command. -
Depending on Jaeger’s sampling settings
JAEGER_SAMPLER_TYPEandJAEGER_SAMPLER_PARAM, Jaeger may not report every spans created by the applications.
Faster app startup with Liberty annotation caching
During application startup, application classes are scanned for class signature information and for annotations. Typically, all application classes are scanned, which is time consuming.
For early access, annotation caching is enabled when the product edition is EARLY_ACCESS. For other product editions,annotation caching is disabled.
Annotation caching may be enabled (or disabled) by setting java custom property anno.beta. Setting this property to true enables annotation caching, while setting this property to false disables annotation caching. Setting the anno.beta property overrides enablement based on the product edition.
When annotation caching is enabled, a custom property is available for adjusting the caching function: Setting java custom property anno.cache.readOnly prevents the annotation engine from writing new cache data. Already saved cache data will be read, but no new cache data will be written. This setting may be necessary in certain deployment environments.
Cache data is visible as a new, nested directory of server workarea named anno. Cache data uses a binary format and is not human readable. Cache data is relocatable: Movement of a server image to a new location does not require that annotation cache data be regenerated. Cache of application class data is cleared when performing a clean server start (starting the server with the --clean option). In normal operations, the clearing of cache data is not necessary, since the cache automatically regenerates cache data for changed application classes. However, the cache function has no way to tell when cache data is obsolete. If the same server is used with many different applications, annotation cache data will accumulate on disk, and a clean start should be performed occasionally to remove stale cache data.
In pipeline deployment environments, for example, Docker, for annotation caching to be effective, the server image must be "warmed" before packaging the deployment image, and application class cache data must be included in the deployment image. Warming the server means performing a single start of the server. This will cause cache data to be generated and available when packaging the server image. A failure to generate the cache data or to include the cache data in the deployment image will result in longer startup times, since a typical startup uses a fresh copy of the deployment image, which will not have any cached data.
The following chart shows changes to server startups with annotation caching enabled, relative to server startup times for the same application and with annotation caching disabled.
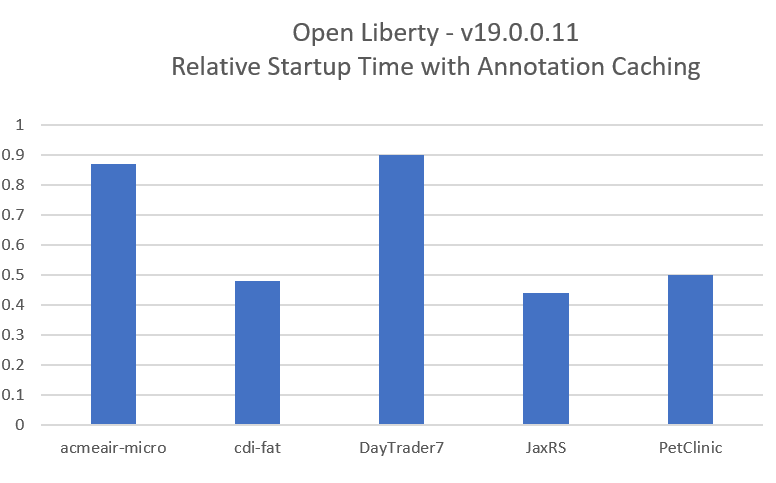
Startup times with annotation caching enabled have cache data already generated. Generally, performance improvements are larger for larger applications, and for applications which use CDI or web service functionality.
For more information:
You are now free to use GraphQL with Open Liberty!
In our latest OpenLiberty development builds, users can now develop and deploy GraphQL applications. GraphQL is a complement/alternative to REST that allows clients to fetch or modify remote data, but with fewer round-trips. Liberty now supports the (still under development) MicroProfile GraphQL APIs (learn more) that allow developers to create GraphQL apps using simple annotations - similar to how JAX-RS uses annotations to create a RESTful app.
Developing and deploying a GraphQL app is cinch - take a look at this sample to get started with these powerful APIs!
Get Liberty 19.0.0.11 now
Available through Maven, Gradle, Docker, and as a downloadable archive.


