Get alerts from your Open Liberty apps in Slack using Prometheus Alertmanager in RHOCP 4.3

Our original blog post was well received, so we’re publishing a version that’ll set you up on Red Hat OpenShift Container Platform too.
Every application needs a strong monitoring system to catch unexpected issues, whether it’s an overloaded heap or a slow-responding servlet. MicroProfile Metrics provides the ability to expose metrics for your application. When used along with the Prometheus open source monitoring system and the Prometheus Alertmanager, we can build a strong foundation for monitoring your system and reacting quickly to issues.
In this post, we’ll set up Prometheus Alertmanager on Red Hat OpenShift Container Platform (RHOCP) 4.3 using the Prometheus Operator. The Alertmanager will fire alerts to a specified Slack channel to notify you when, for example, your app’s heap usage is too high. We’ll configure Prometheus with alerting rules to receive certain alerts from Open Liberty. Then, we’ll configure Prometheus Alertmanager to pass those alerts to a Slack channel.
Already familiar with Alertmanager? Check out some sample rules for Open Liberty. The repository also contains the configuration files used as an example in this blog post, in case you get stuck along the way.
What you’ll need
You will need an RHOCP 4.3 cluster. You can try these steps on other versions, but this blog was written on and tested with 4.3.
Before we start, make sure your app is configured with an Open Liberty server with the mpMetrics-2.0 feature enabled. Ensure that it is deployed on an RHOCP cluster and the /metrics endpoint is available. The Open Liberty Operator observability doc has more information on how to configure your server for monitoring.
You also need a Slack channel to send alerts to, as well as a Slack webhook for that channel.
Configure Prometheus to monitor metrics from Open Liberty on RHOCP 4.3
Follow the Kabanero guide to set up Prometheus using the Prometheus Operator.
You only need to follow the guide to Step 11. However, it is helpful to deploy Grafana so you have a visualization of your metrics.
Creating Prometheus alerting rules
Create a new PrometheusRule instance in the Prometheus Operator. This instance creates alerting rules in Prometheus to define which metrics will be received by the Alertmanager.
-
Go to the OpenShift Container Platform web console and click Operators > Installed Operators > Prometheus Operator > Prometheus Rule.
-
Create a PrometheusRule instance. Under
spec.groups, add a new rule group calledlibertyexampleto the YAML:spec: groups: - name: ./example.rules rules: - alert: ExampleAlert expr: vector(1) - name: libertyexample rules: - alert: heapUsageTooHigh expr: base_memory_usedHeap_bytes / base_memory_maxHeap_bytes > 0.9 for: 1m labels: severity: warning annotations: summary: "Heap usage is too high" description: "{{ $labels.instance }} heap usage is too high"This rule will send an alert called
heapUsageTooHighwhen the PromQL querybase_memory_usedHeap_bytes / base_memory_maxHeap_bytesis greater than0.9(90%) for one minute. For testing purposes, feel free to change the threshold to something smaller, like0.05.If you’re new to PromQL, check out Querying Prometheus.
You might’ve noticed that there’s a rule group with the name
./example.rulescreated by default. This is a rule that always fires an alert, so you can keep this for now to test your configuration. -
Change the labels in your
PrometheusRuleto match theruleSelectorin your Prometheus YAML. For example, if you used theprometheus.yamlin the Kabanero guide, your Prometheus YAML would contain:ruleSelector: matchLabels: prometheus: k8s role: prometheus-rulefilesSo your
PrometheusRulelabels must match:labels: prometheus: k8s role: prometheus-rulefiles -
Navigate to your Prometheus route and click Status > Rules to verify that the rules were loaded in properly.
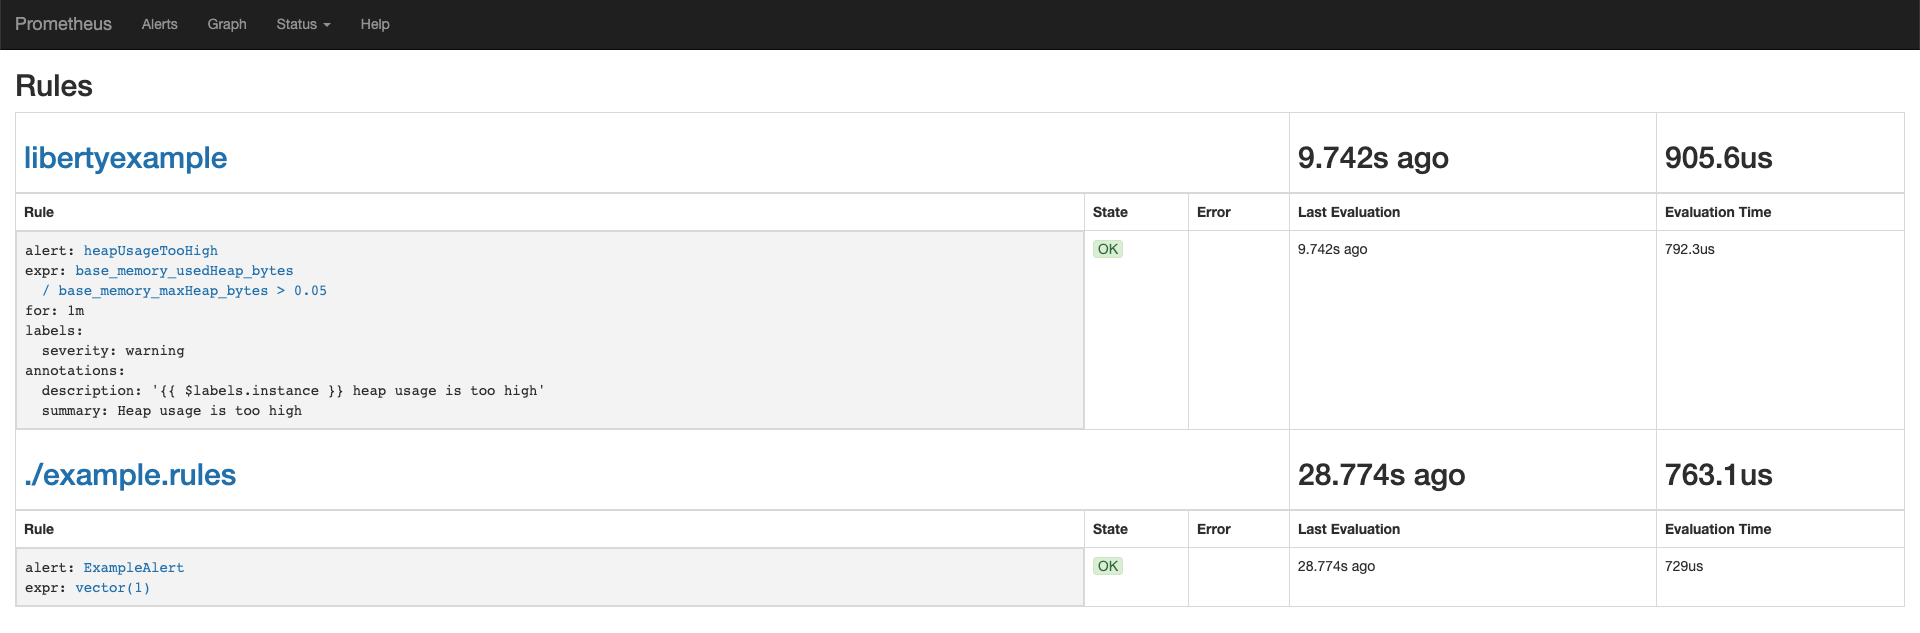
-
To check that your alerts are firing, click Alerts. As we didn’t remove the
./example.rulesrule group, you should already see at least one alert firing. To ensure that your custom rules are also working, generate some data or drastically lower the threshold of the PromQL query.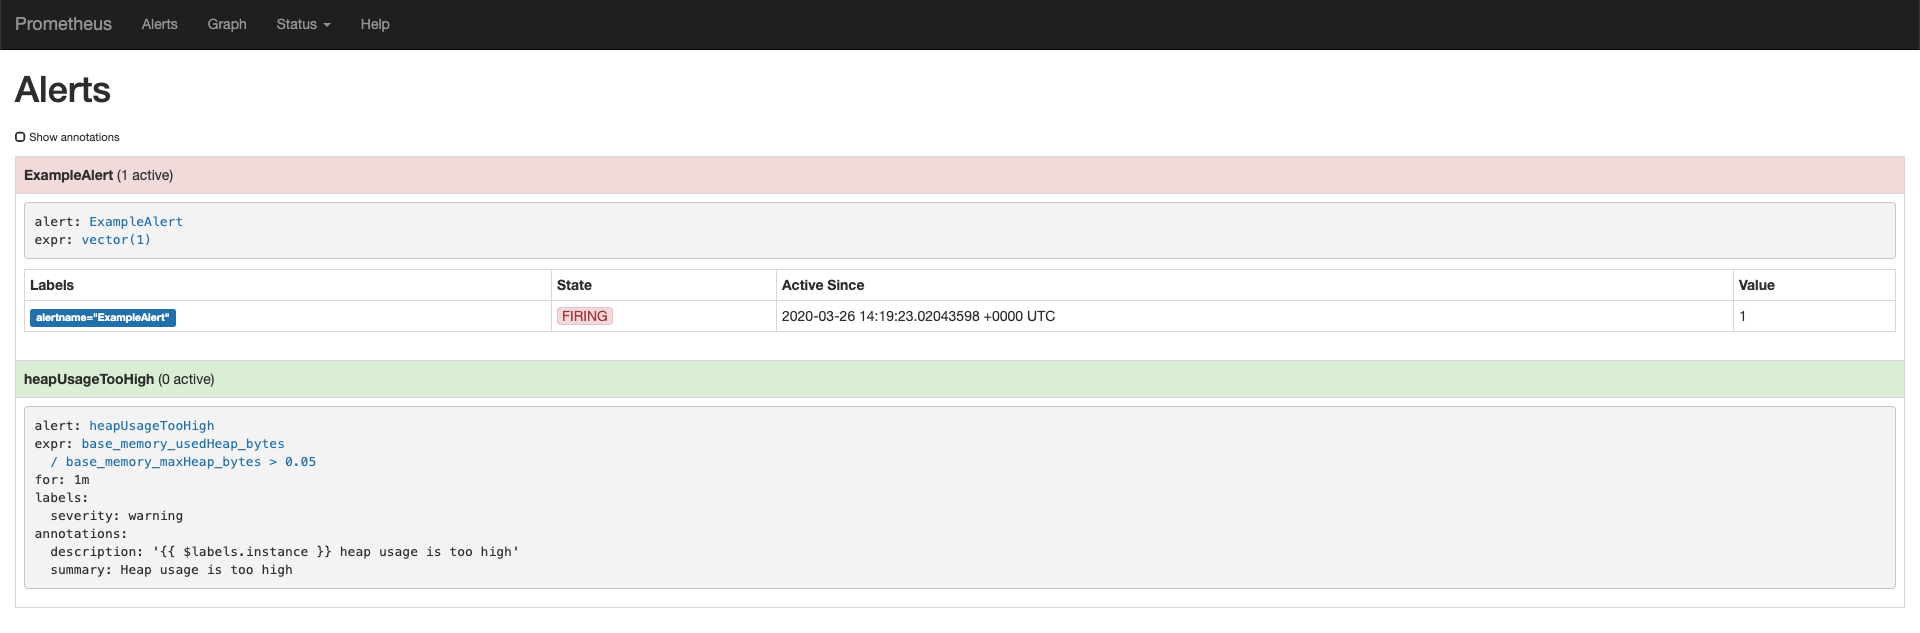
Create and configure Prometheus Alertmanager to pass alerts to Slack
In this section, you’ll create and configure the Prometheus Alertmanager to send customized messages to your Slack channel based on the alerting rules we set up earlier.
Creating and configuring the Prometheus Alertmanager to communicate with Slack
Now that Prometheus is set up with rules for our Open Liberty server, we can create an Alertmanager instance that has the ability to connect to Slack.
-
Create a file named
alertmanager.yaml, and remember the directory, as we will be creating a secret using this file. This file is configured using the same steps from the original blog post. We’ll start with a simple configuration. Your file will look like this:global: resolve_timeout: 5m slack_api_url: <your slack webhook api url> # The root route. This route is used as the default # if there are no matches in the child routes. route: group_by: [ alertname ] group_wait: 10s group_interval: 10s repeat_interval: 5m receiver: 'default_receiver' receivers: - name: 'default_receiver' slack_configs: - channel: 'prometheus-alertmanager-test' title: "{{ range .Alerts }}{{ .Annotations.summary }}\n{{ end }}" text: "*Description*: {{ .CommonAnnotations.description }}\n*Severity*: {{ .CommonLabels.severity }}"In this example, we have one route that sends the alert to
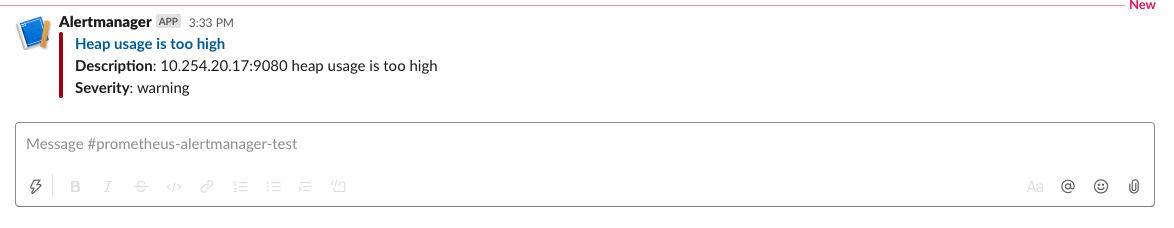
default_receiver. The receiver sends the alert to a Slack channel calledprometheus-alertmanager-test. TheCommonAnnotationscome from theannotationsyou specified in your Prometheus rule. The text is written using the Go templating system. -
On the RHOCP web console, click Operators > Installed Operators > Prometheus Operator > Alertmanager and create an
Alertmanagerinstance. You do not need to change the default YAML. -
Create a secret with your
alertmanager.yamlfile. The name of the secret should be the name of your Alertmanager prefixed byalertmanager:❯ oc create secret generic alertmanager-alertmanager-main --from-file=alertmanager.yaml secret/alertmanager-alertmanager-main createdIn this example, the name of our secret is
alertmanager-alertmanager-mainbecause we add thealertmanagerprefix to our Alertmanager’s name, which isalertmanager-main. -
Check that the service has started successfully.
❯ oc get svc -n prometheus-operator NAME TYPE CLUSTER-IP EXTERNAL-IP PORT(S) AGE alertmanager-operated ClusterIP None <none> 9093/TCP,9094/TCP,9094/UDP 18m prometheus-operated ClusterIP None <none> 9090/TCP 64m -
Once your pods are up and running, expose the route:
❯ oc expose svc/alertmanager-operated -n prometheus-operator
route.route.openshift.io/alertmanager-operated exposed
❯ oc get route -n prometheus-operator
NAME                    HOST/PORT                                                                  PATH   SERVICES                PORT   TERMINATION   WILDCARD
alertmanager-operated   alertmanager-operated-prometheus-operator.apps.jenniferc.os.fyre.ibm.com          alertmanager-operated   web                  None
prometheus-operated     prometheus-operated-prometheus-operator.apps.jenniferc.os.fyre.ibm.com            prometheus-operated     web                  None
You can now access the Alertmanager UI. Since we haven’t yet configured Prometheus to send the Alertmanager any alerts, you won’t see any alert groups at the moment. We’ll do that next.
Receiving alerts via Prometheus Alertmanager
Now that the Alertmanager is set up, we need to configure Prometheus to talk to it.
-
First, we’ll need to expose the Alertmanager port. On the RHOCP web console, click Networking > Services > Create Service. Create a ClusterIP service:
apiVersion: v1
kind: Service
metadata:
  name: alertmanager-example-service
  namespace: prometheus-operator
spec:
  type: ClusterIP
  ports:
  - name: web
    port: 9093
    protocol: TCP
    targetPort: web
  selector:
    alertmanager: alertmanager-main
The
selector.alertmanagermust match your Alertmanager’s name if you changed it from the default value. -
On the RHOCP web console, click Operators > Installed Operators > Prometheus Operator > Prometheus, then click on the name of your Prometheus instance.
-
In the YAML, add your new service to the
alertmanagersthat Prometheus can talk to.spec: alerting: alertmanagers: - name: alertmanager-example-service namespace: alertmanager port: web -
Go to your Prometheus route, then click Alerts. Ensure that at least one alert is firing.
-
Verify that the Alertmanager has received the alert by going to the Alertmanager route.
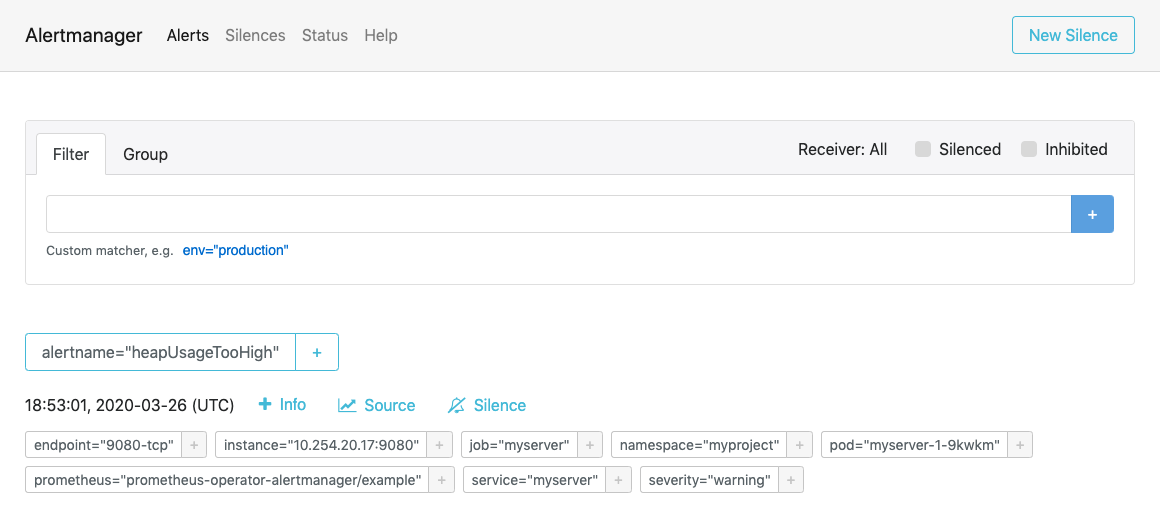
-
Check your Slack channel to see your message.
For more advanced configurations, check out the additional tips for when you’re creating larger alerting systems in the original blog post. To load in new rules, you can edit your PrometheusRule instance’s YAML from the web console, under Operators > Installed Operators > Prometheus Operator > Prometheus Rule. Similarly, to update your Alertmanager configuration, simply edit your alertmanager.yaml and re-create the secret.


