Deploy and configure Jaeger for distributed tracing on OpenShift


Distributed tracing helps DevOps teams keep track of requests between microservices. Jaeger and Zipkin are popular distributed tracing frameworks, though Jaeger is arguably the more popular choice on Red Hat OpenShift because it is the distributed tracing component of the Red Hat OpenShift Service Mesh framework.
We recently published a new Open Liberty guide for developers on how to enable Jaeger distributed tracing in microservice applications. This blog post describes how to deploy and configure Jaeger to trace the guide’s sample microservice applications on OpenShift.
Install Jaeger and Elasticsearch to collect and store the logs on OpenShift
The foolproof way to deploy Jaeger on OpenShift is using the Jaeger Operator, which is easy to install from OperatorHub. The Jaeger Operator helps to automate the setup of many security-related configurations. In this article, we’ll also install Elasticsearch, using the Elasticsearch Operator, to store and persist the data collected by Jaeger.
Before the installation, let’s first create a new project on our OpenShift cluster called jaegertracing:
oc new-project jaegertracingNext, install the Elasticsearch Operator then the Jaeger Operator from OperatorHub into the jaegertracing project. There are two Jaeger Operators offered by OperatorHub, a Red Hat Jaeger Operator and a Community Jaeger Operator. The Red Hat one is the only one supported by Red Hat if you are a paid customer, and it’s usually a couple releases behind the community ones in terms of the version number. So choose the flavour that suits your organizational needs the best. For this blog post, we will use the Community Jaeger Operator.
After the installation of both the Elasticsearch Operator and the Jaeger Operator, check on the Installed Operators page that both are installed successfully.
Configure Jaeger
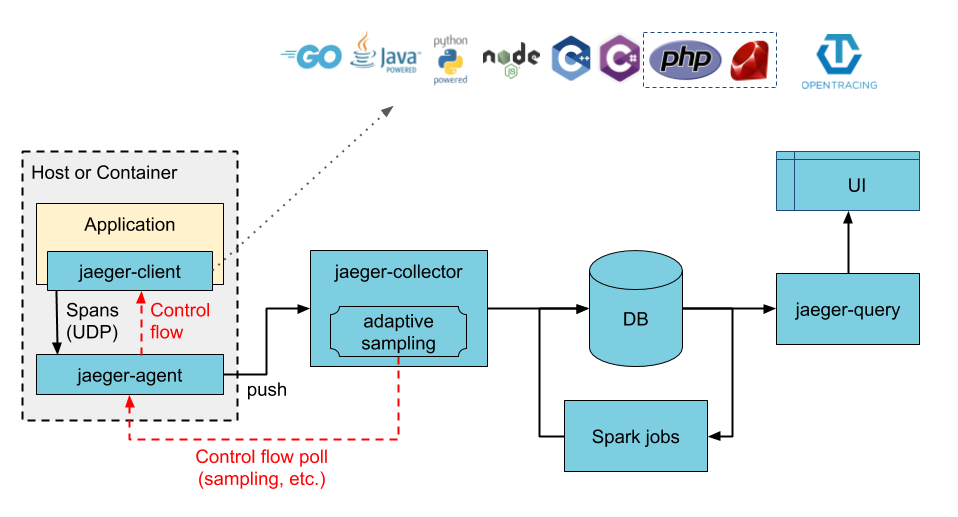
Jaeger has three main components: agent, collector, and query. There is also the Jaeger client, which is part of your application and is responsible for creating tracers and spans in the application code. In a typical Jaeger workflow on OpenShift, the Jaeger client creates trace spans in the application code which get picked up by the Jaeger agent over UDP and forwarded to the Jaeger collector using a secured gRPC connection. The Jaeger collector stores the data so that you can query and visualize the trace spans using the Jaeger query service. The following diagram illustrates the overall architecture:
There are three pre-defined Jaeger deployment strategies that are supported by the Jaeger Operator. A deployment strategy dictates how the Jaeger components should be deployed on OpenShift. In this blog post we use the production strategy because it deploys the collector and query processes individually as separate pods on OpenShift, which can be scaled individually on demand. The production strategy also supports secured connections with Elasticsearch. While the default allInOne strategy is an easy way to start and manage all Jaeger components for demonstration purposes, its extremely limited capability makes it unsuitable for even some serious test or development scenarios. In particular, it uses memory as its backend storage so there is no real data persistence, and it does not allow any scaling.
To configure the Jaeger instance, we need to create the following jaeger.yaml file:
apiVersion: jaegertracing.io/v1
kind: Jaeger
metadata:
  name: simple-prod
spec:
  strategy: production
  storage:
    type: elasticsearch
    elasticsearch:
      nodeCount: 1
      resources:
        requests:
          cpu: 200m
          memory: 1Gi
        limits:
          memory: 1Gi
There is barely any detailed configuration for Elasticsearch in the jaeger.yaml file. This is because the Jaeger Operator is able to detect any existing Elasticsearch instance that has been deployed by the Elasticsearch Operator, and auto-provision the secured communication between the Elasticsearch and Jaeger processes.
Create the Jaeger instance using the Jaeger Operator page in the Openshift console or by running the following oc command:
oc create -n jaegertracing -f jaeger.yamlWhen the Jaeger instance has been created, the following pod processes are running on your cluster:
[root@fwji1-ocp43-inf ~]# oc get pods -n jaegertracing
NAME                                                           READY   STATUS      RESTARTS   AGE
elasticsearch-cdm-jaegertrarcingsimpleprod-1-cb8fd749b-kqtkx   2/2     Running     0          50d
simple-prod-collector-6f654659bb-8868l                         1/1     Running     0          9d
simple-prod-query-864dfd87b4-wxrps                             2/2     Running     0          12h
Prepare your application for OpenShift
Now we need to deploy a sample application that can create some trace spans for us to test. Open Liberty supports OpenTracing and Jaeger natively so you can write applications using MicroProfile OpenTracing which automatically generate traces using annotations, as described in Open Liberty’s Enabling distributed tracing in microservices with Jaeger guide.
I used the system and inventory apps from the Open Liberty guide and created two deployment YAML files for OpenShift deployment. The YAML files can be found in the sample-deployments folder. Before deploying both the apps to your OpenShift cluster, let’s take a closer look at the system service’s Deployment object spec from the system.yaml file:
apiVersion: apps/v1
kind: Deployment
metadata:
  annotations:
    sidecar.jaegertracing.io/inject: "true"
  creationTimestamp: null
  labels:
    app: system
  name: system
spec:
  replicas: 1
  selector:
    matchLabels:
      app: system
  strategy:
    resources: {}
  template:
    metadata:
      creationTimestamp: null
      labels:
        app: system
    spec:
      containers:
      - env:
        - name: JAEGER_REPORTER_LOG_SPANS
          value: "true"
        - name: JAEGER_SAMPLER_PARAM
          value: "1"
        - name: JAEGER_SAMPLER_TYPE
          value: const
        image: 'frankji/system-image'
        name: system
        ports:
        - containerPort: 9080
        - containerPort: 9443
        resources: {}
      restartPolicy: Always
  test: false
status: {}
In the YAML file, the Deployment controller is annotated with sidecar.jaegertracing.io/inject: "true" so that the agent is injected as a sidecar container within the application pod. If there are multiple Jaeger instances defined in the working namespace, you have to replace "true" with the Jaeger instance name to specify which Jaeger instance you want your application to be associated with.
The image frankji/system-image is a Java application running on Open Liberty with the MicroProfile OpenTracing feature enabled. The configuration also defines some environment variables that are used by the Jaeger client in the sample application. Of the environment variables used, JAEGER_SAMPLER_TYPE=1 and JAEGER_SAMPLER_PARAM='const' are set to make sure that every trace generated by the Jaeger client is sampled by the Jaeger collector. JAEGER_REPORTER_LOG_SPANS='true' is set to turn on the logging of the Jaeger client in the Java microservice, so that we know that a trace has been generated.
Now it’s time to deploy both the system application and the inventory application to the OpenShift cluster. Download the system.yaml and inventory.yaml from the GitHub repo. Replace the namespace and the host name with your own values in the Route object spec in both files, then run the following commands:
oc create -n jaegertracing -f system.yaml
oc create -n jaegertracing -f inventory.yaml
When deployed, you can generate some traces by visiting the following URLs:
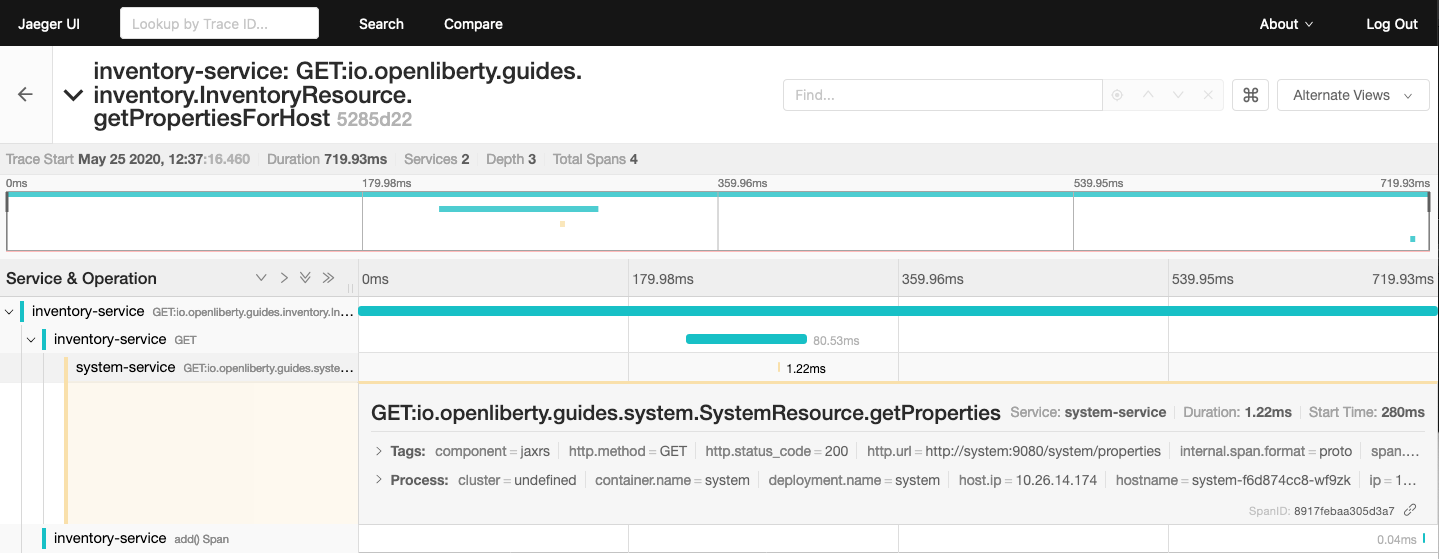
You should then be able to see the trace spans generated by the application on the Jaeger query UI:
Summary
Distributed tracing has become essential in the world of observability for microservices. With the Jaeger Operator, most users can now start doing distributed tracing on OpenShift with minimum manual configuration. Yet it still offers tons of configurable options for advanced users to make use of the full potential of Jaeger.
If you want to learn more about Jaeger, the Jaeger home page is still the best resource for Jaeger and Jaeger Operator documentation.


